Data Science & Analytics
Open-source tools cited in Nature, Cancer Discovery, and 51 other peer-reviewed publications
The Problem
Researchers spend hours wrestling with geographic data that should take minutes. ZIP code lookups require expensive APIs. Distance calculations need manual geocoding. Demographic overlays mean stitching together multiple data sources. Time that should go toward research goes toward data prep instead.
Gavin Rozzi builds open-source tools that eliminate this friction. His R package zipcodeR has been cited in 53+ peer-reviewed publications—including Nature and Cancer Discovery—enabling breakthrough research in public health, epidemiology, and environmental science.
zipcodeR
An R package enabling peer-reviewed research in cancer, public health, and environmental science. Cited in Nature, Cancer Discovery, and 51 other publications.
CRAN R Packages
Open source tools for geospatial analysis and data science, all published on CRAN.
zipcodeR
U.S. ZIP code analysis with distance calculations, demographics, and boundaries.
115,000+ total downloadsnjgeo
New Jersey geocoding using the state's official NJOGIS API.
Free geocoding alternativenjtr1
NJ motor vehicle crash data from NJDOT for transportation research.
2001-Present dataHow This Informs Policy Decisions
These technical capabilities translate directly into better policy outcomes. The NJ HOMES Choice Tool uses geospatial analysis to help 564 municipalities understand their affordable housing obligations. The dashboards we build at DCA don't just display data—they inform decisions about housing allocation, compliance tracking, and resource distribution across the state.
When cancer researchers need to analyze ZIP code-level data, zipcodeR eliminates weeks of data preparation. The package has been cited in studies of childhood cancer clusters, environmental health disparities, and COVID-19 outcomes. Tools built for one purpose end up enabling research that informs public health policy nationwide.
At DCA, we use the same analytical approaches to measure program effectiveness. If a housing program isn't reaching its target communities, the data shows it. If compliance reporting takes too long, we redesign the system. Evidence-based decisions require evidence infrastructure, and building that infrastructure is core to what I do.
Data Science Projects
NJ Civil Service Navigator
Web platform making 5,128+ NJ Civil Service job specifications searchable and accessible for job seekers, HR professionals, and hiring managers.
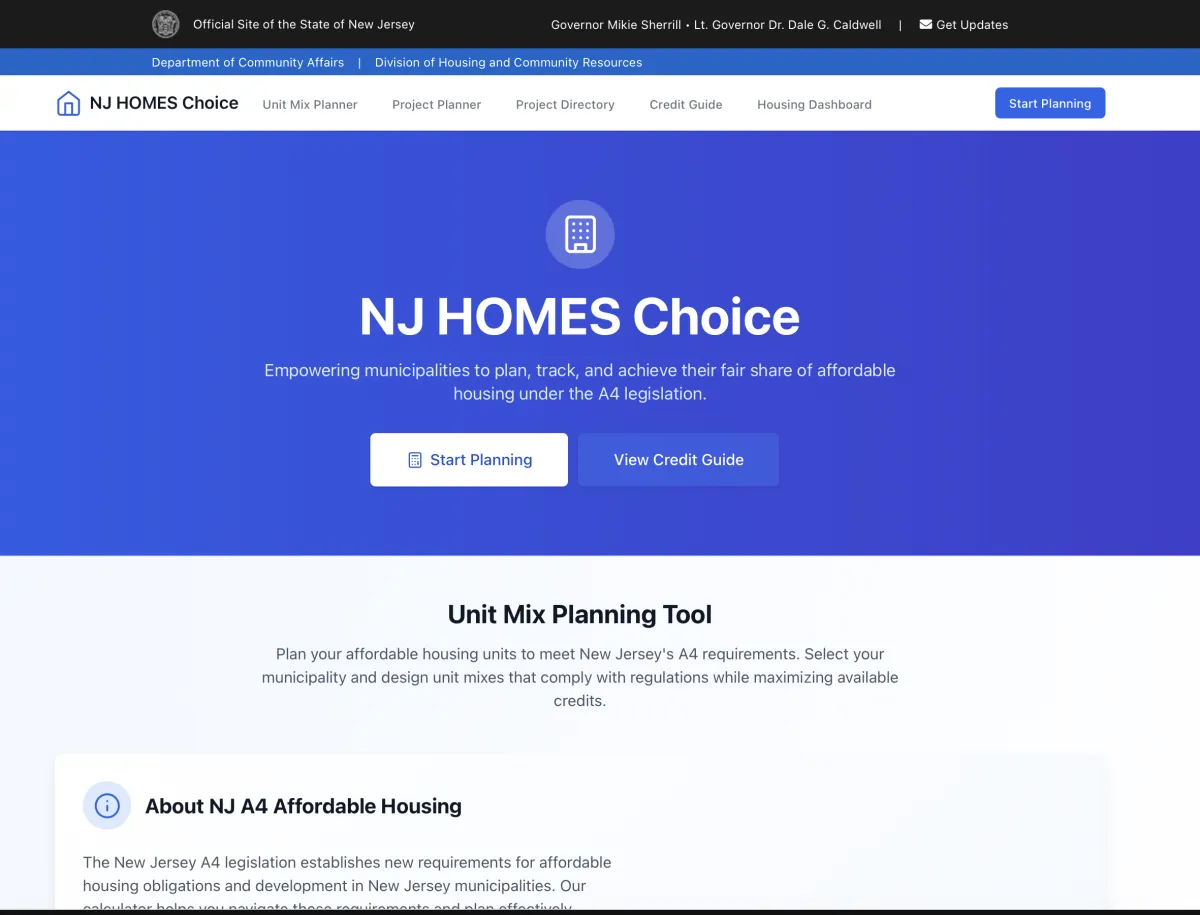
NJ HOMES Choice Tool
Interactive planning tool implementing A4/S50 affordable housing calculations for all 564 municipalities, supporting NJ HOMES grantmaking and municipal compliance.

Winter Termination Program Digital Transformation
Digital transformation of New Jersey's utility shutoff protection self-certification process, replacing a manual PDF with an accessible electronic form.
Operation Right Answer: Housing Services Modernization
Led development of a data-driven service framework to modernize how New Jersey housing programs serve residents, partnering with the New Jersey Innovation Authority to implement AI-assisted contact center technology.
NJ Eviction Guide
Interactive self-help tool connecting New Jersey's most vulnerable residents directly to housing assistance and legal resources.
Bringing Veterans Home Digital Infrastructure
Statewide digital infrastructure supporting New Jersey's initiative to end veteran homelessness—data systems, electronic referrals, and public website development.
Municipal Lead Reporting Portal
Statewide compliance platform capturing residential lead-paint inspection data for all 564 New Jersey municipalities.
New Jersey Opioid Overdose Spatial Analysis
Grant-funded spatial analysis identifying opioid overdose hotspots across New Jersey using state administrative data and advanced geospatial methods, conducted as a Research Affiliate at Rutgers.
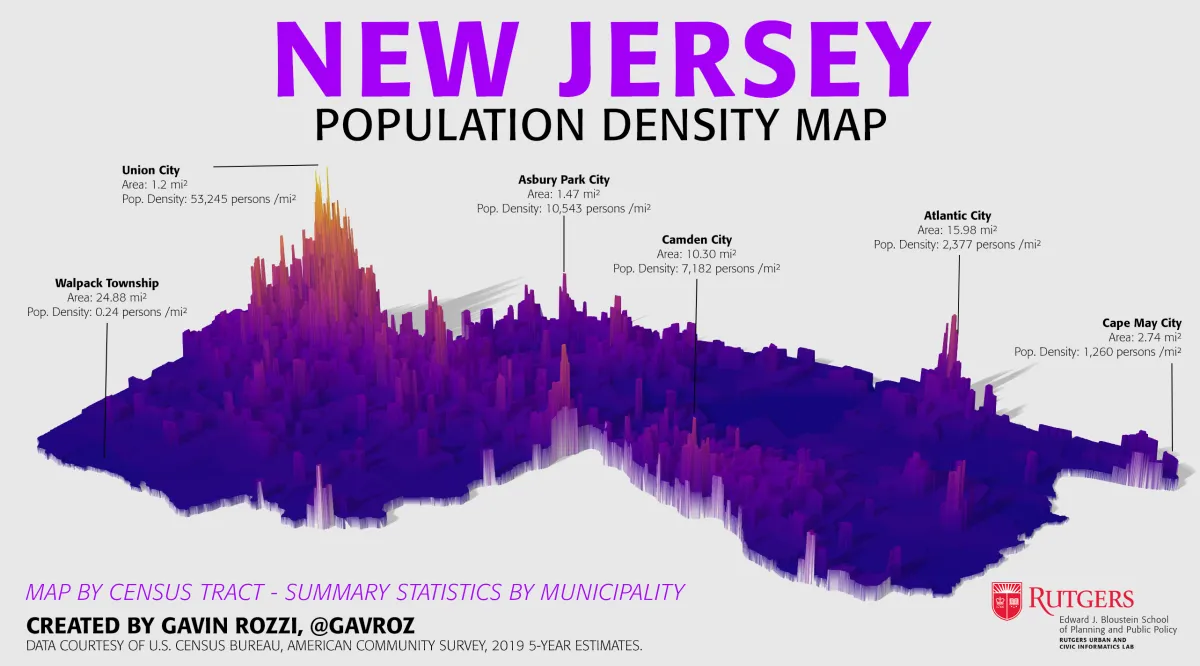
New Jersey Population Density Map
Award-winning 3D visualization of New Jersey population density using rayshader, winning First Place in the 3D category at the NJ DEP GIS Mapmaking Contest.
njgeo
An R package for geocoding addresses using New Jersey's official geocoding service, freely available as an alternative to commercial solutions.
njtr1
An R package that makes it easy to download and analyze New Jersey motor vehicle crash data for transportation research and safety analysis.
TrentonTracker
A modern Progressive Web App making New Jersey legislative data accessible and searchable, with ZIP code-based legislator lookup.
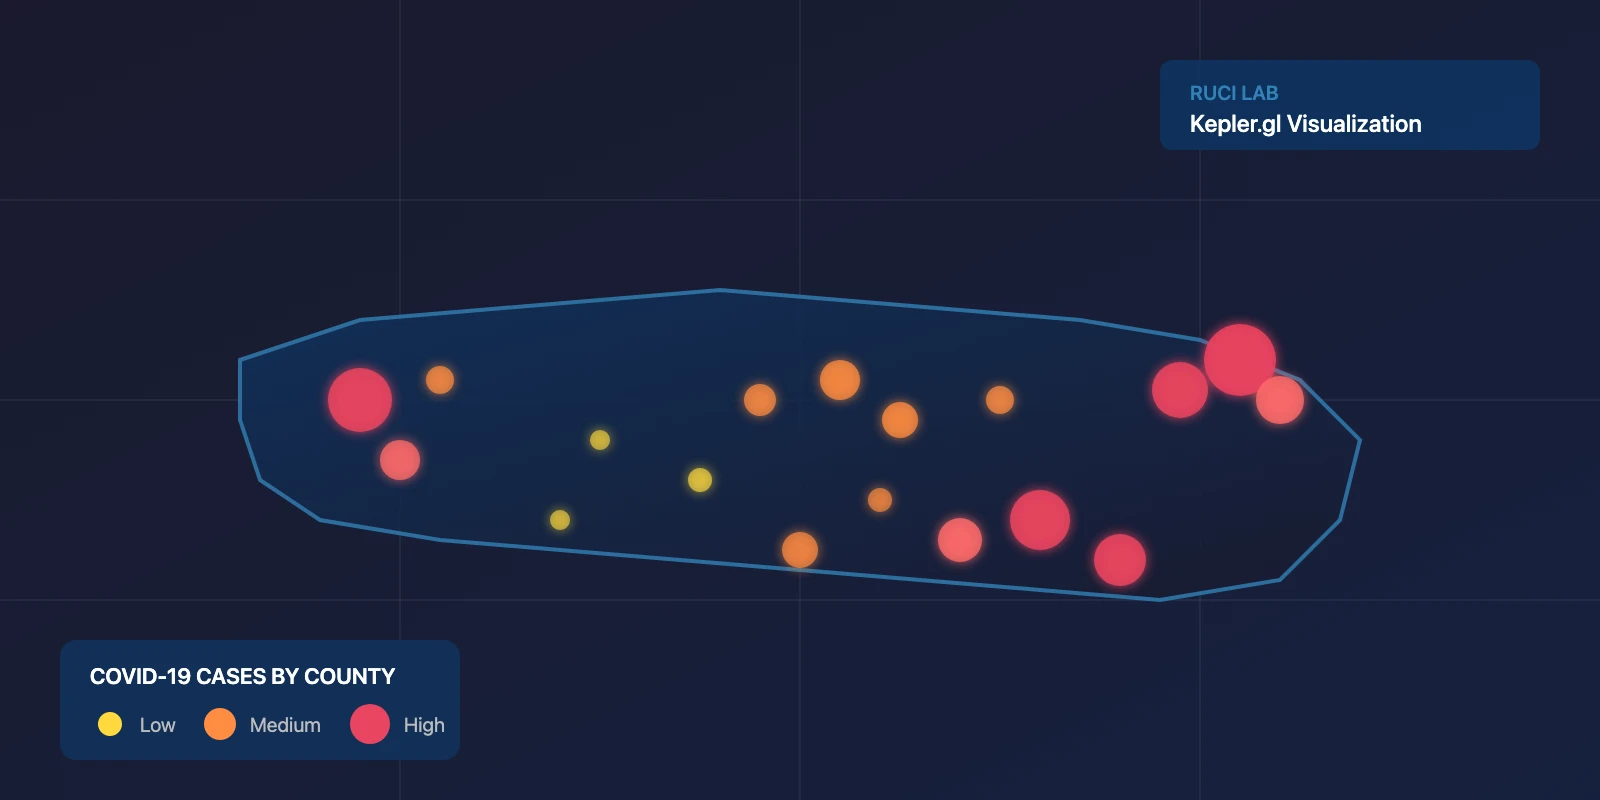
COVID-19 Spread Visualization
Interactive web-based visualization tracking the spread of COVID-19 across U.S. counties using advanced GIS technologies and real-time data processing.
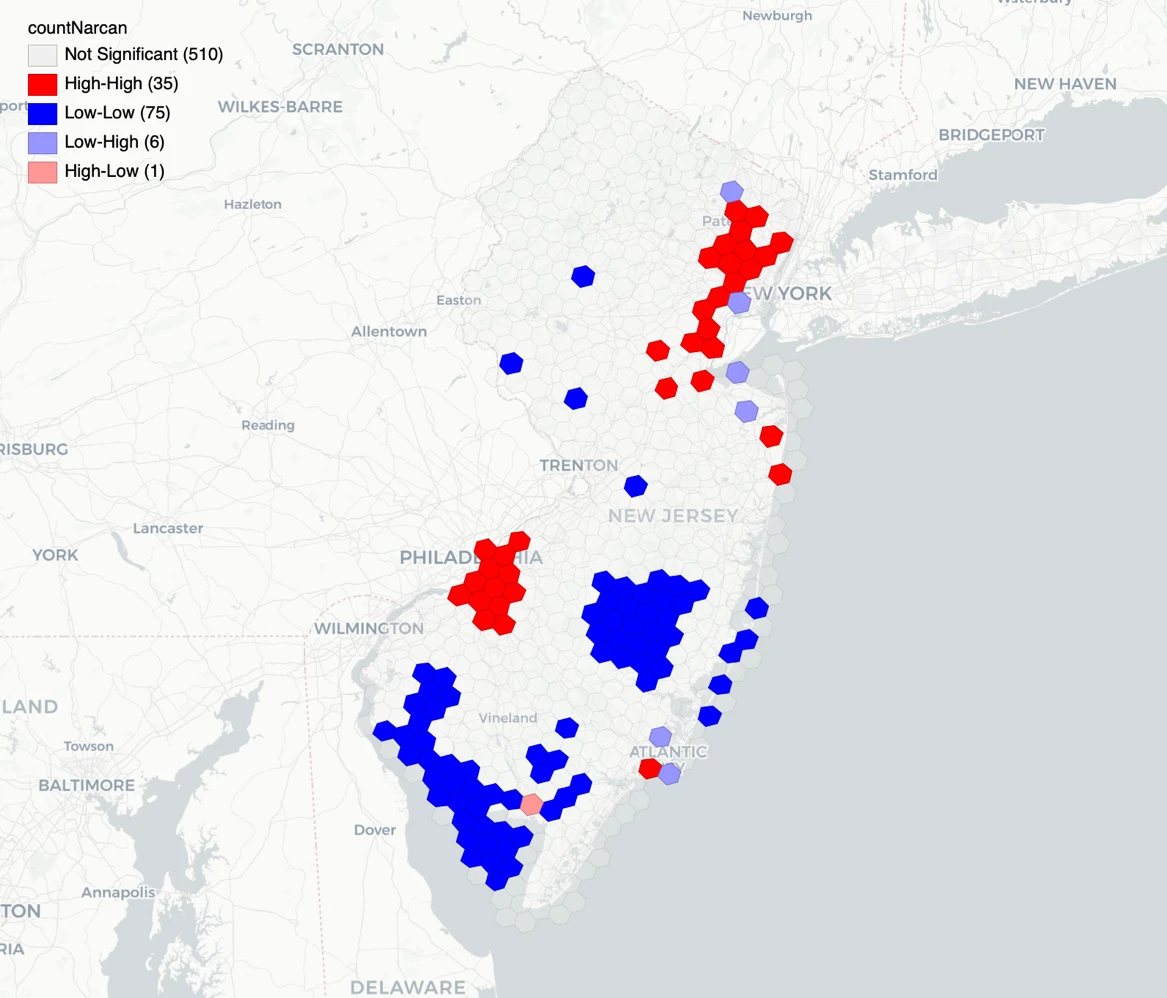
NJ Narcan Dashboard
An interactive dashboard tracking opioid overdose interventions across New Jersey through law enforcement Narcan deployment data.
zipcodeR
An R package with 53+ peer-reviewed citations including Nature, Cancer Discovery, and MIS Quarterly, enabling breakthrough research in public health, epidemiology, and environmental science.
OPRAmachine
New Jersey's first statewide freedom of information platform, processing over 75,000 public records requests and releasing 250GB of government data.
Publications
The Dark Side of Sentiment Analysis: An Exploratory Review Using Lexicons, Dictionaries, and a Statistical Monkey and Chimp
SSRN
Jan 2022
journalnjtr1: An R package for researching road safety in New Jersey using open crash data
Software Impacts
Nov 2021
journalzipcodeR: Advancing the analysis of spatial data at the ZIP code level in R
Software Impacts
Jun 2021
journalThe first statewide, open access dataset tracking public records requests in New Jersey
Data in Brief
Jul 2020
Articles & Tutorials
zipcodeR Reaches 53+ Peer-Reviewed Citations, Including MIS Quarterly
My open-source R package for ZIP code analysis has now been cited in 53+ peer-reviewed publications, including MIS Quarterly—a Financial Times Top 50 journal.
Mar 21, 2026Making Data Tell Stories: Visualization for Public Policy
How effective data visualization can transform complex policy issues into actionable insights for decision-makers and the public
Jun 22, 2024React and TypeScript Best Practices for Government Applications
Lessons learned building production React applications with TypeScript for government clients who demand reliability, accessibility, and security
Feb 15, 2024Digital Transformation in Government: Lessons from the Trenches
Practical insights on modernizing government technology infrastructure and processes from years of hands-on experience
May 12, 2023Why Open Data Matters for Government Transparency
Exploring how open data initiatives improve government services and enable citizen engagement in the digital age
Aug 20, 2022A Spatial Analysis of New Jersey's Medical Cannabis Dispensary Accessibility
An isochrone-based GIS analysis revealing that over 756,000 New Jerseyans in 110 municipalities face 30+ minute drives to the nearest medical cannabis dispensary.
Apr 17, 2022Frequently Asked Questions
What is zipcodeR and what can it do?
zipcodeR is an R package for working with U.S. ZIP code data, created by Gavin Rozzi. It provides functions for looking up ZIP code information, calculating distances between ZIP codes, finding ZIP codes within a radius, and accessing demographic data. The package has 115,000+ total downloads on CRAN.
What programming languages does Gavin Rozzi use for data science?
Gavin Rozzi primarily uses R for data science, including package development, statistical analysis, and data visualization with ggplot2. He also works with SQL, Python, and various GIS tools for geospatial analysis.
What is geospatial analysis and how is it used?
Geospatial analysis involves working with geographic data to understand spatial patterns and relationships. It includes GIS mapping, spatial statistics, boundary analysis, and geocoding. Applications include demographic research, public health analysis, and government resource allocation.
How can data science improve government decision-making?
Data science improves government decision-making by providing evidence-based insights that inform operational decisions. At NJ DCA, this means building systems that measure program effectiveness and track compliance outcomes—turning data into measurable impact for residents.
What makes Gavin Rozzi's approach to data science unique?
Gavin Rozzi combines technical data science skills with deep domain expertise in government and public policy. He creates open-source tools used by researchers nationwide, publishes peer-reviewed research, and applies data science to inform decision-making within state government—bridging academic rigor with implementation capacity.
About the Author
