
New Jersey Opioid Overdose Spatial Analysis
Grant-funded spatial analysis identifying opioid overdose hotspots across New Jersey using state administrative data and advanced geospatial methods, conducted as a Research Affiliate at Rutgers.
Overview
As a Research Affiliate at Rutgers’ Bloustein School (2020–2022), I worked with the New Jersey State Policy Lab on a grant-funded project to map opioid overdose hotspots statewide. The raw material was administrative data from the New Jersey State Police — Narcan deployment records, geocoded — and the goal was straightforward: figure out where overdoses are concentrated and whether the patterns are stable enough to inform where the state sends resources.
Data Source
Since 2014, all NJ State Police troopers carry naloxone and are required to administer it for suspected overdoses. That policy created something unusual: a geocoded record of overdose incidents across the entire state, collected consistently over years.
Working with the Office of Drug Monitoring and Analysis, I got access to three years of deployment data (2019–2021).
Methodology
Hexagonal Spatial Indexing
Instead of using county or municipal boundaries — which are irregular and make spatial comparisons messy — I used Uber’s H3 hexagonal indexing. Hexagons give you uniform spatial units, aggregate incidents without revealing exact locations, and the H3 indices slot directly into predictive modeling pipelines if you want to take it further.
I divided New Jersey into 627 hexagons, each covering the same geographic area.
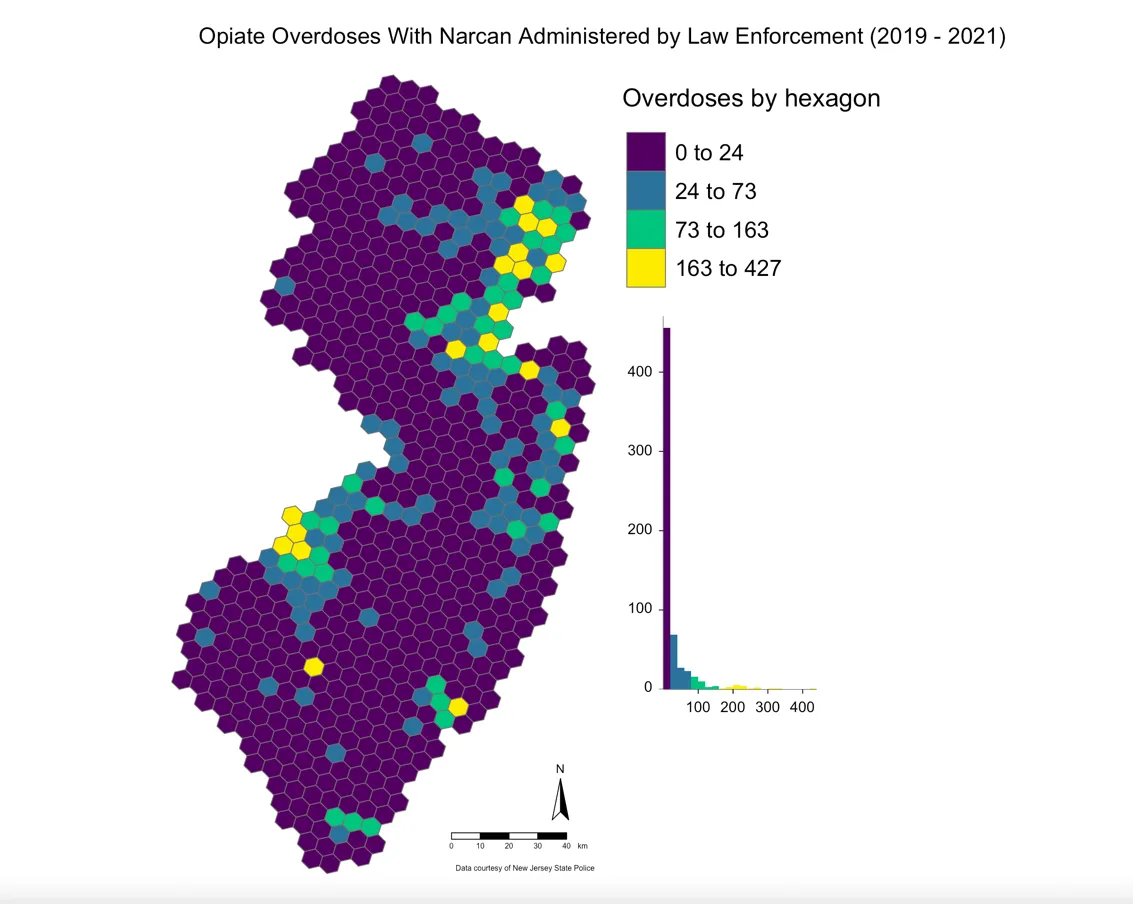 Figure 1: Total Narcan deployment counts by hexagon (2019–2021)
Cluster Detection
I ran Local Indicators of Spatial Association (LISA) statistics in GeoDa to find statistically significant clusters — hot spots (high values surrounded by high values), cold spots (the inverse), and spatial outliers where a hexagon breaks from its neighbors.
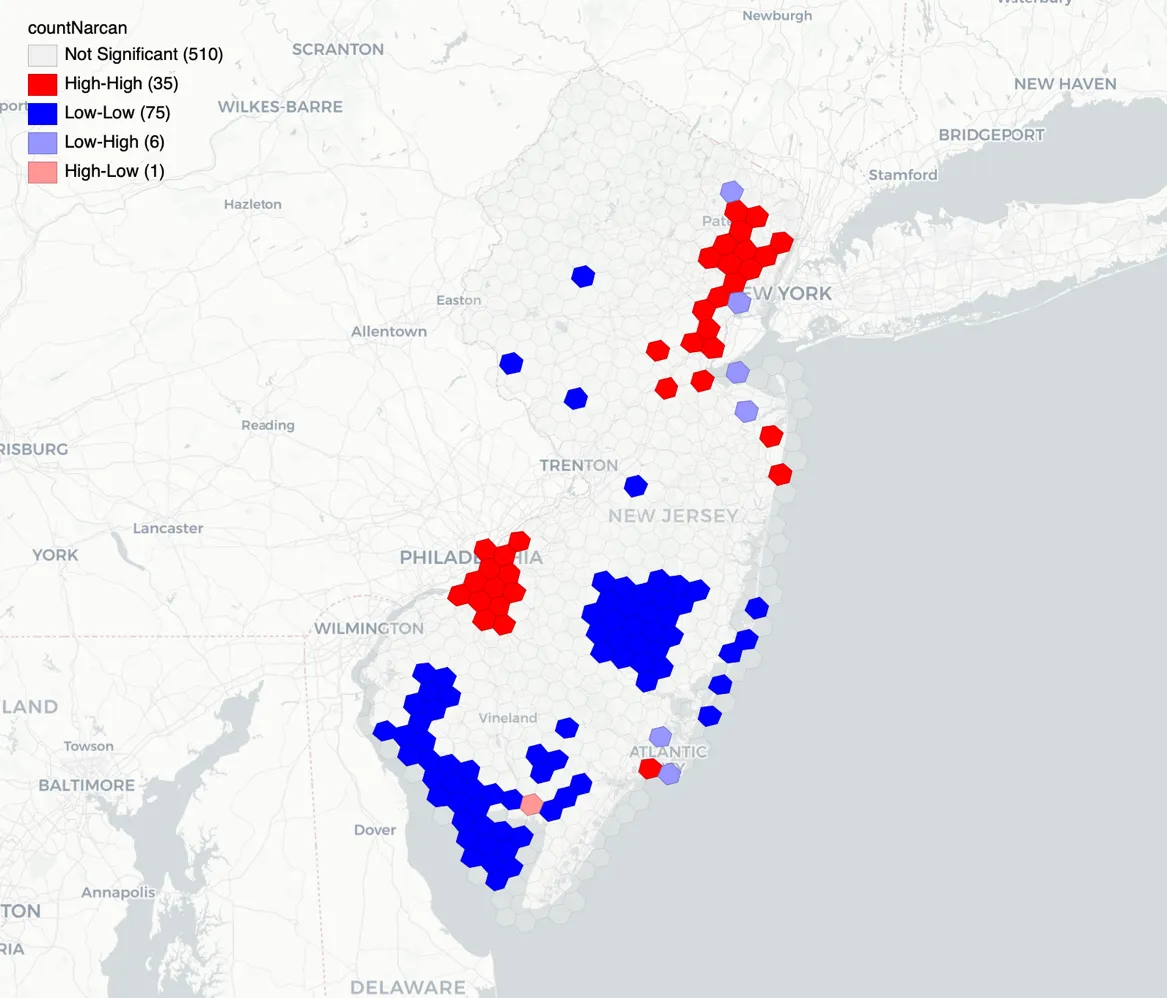 Figure 2: Hot spots (red) and cold spots (blue) identified through LISA analysis
Key Findings
Overdose incidents are not spread evenly across the state — they cluster, and the clusters are stable.
The Camden metro region and the northeastern urban corridor showed up as persistent hot spots across all three years. Northwestern and southern rural areas consistently formed cold spots. The fact that the hot spots didn’t move much over the study period suggests the geographic concentration reflects structural conditions (housing, transit, proximity to treatment) rather than transient spikes.
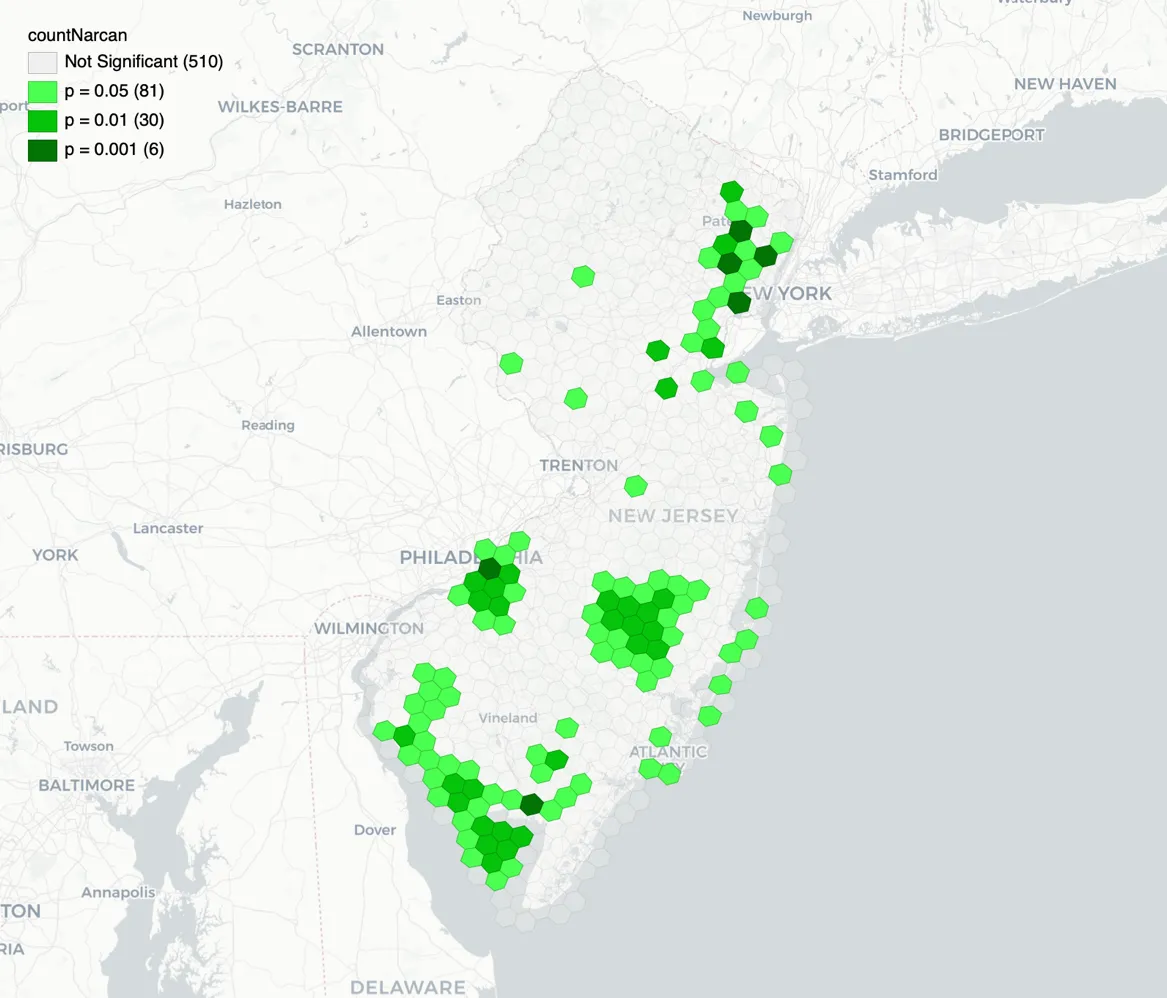 Figure 3: Statistically significant clusters (p < 0.05)
Policy Implications
If overdoses cluster in predictable, stable geographic patterns, you can target prevention and response resources accordingly instead of spreading them thin. The hexagonal framework also opens the door to future work connecting overdose patterns to neighborhood-level variables — housing stock, transit access, treatment facility locations. And the geographic view gives public health, law enforcement, and social services a shared picture to coordinate around.
Technical Approach
R handled data processing, H3 indexing, and statistical analysis. GeoDa did the LISA cluster detection. QGIS produced the maps. The H3 library handled the hexagonal binning and spatial aggregation.
Connection to Current Work
This project shaped how I think about government data generally. Turning administrative records into something spatially legible — whether it’s Narcan deployments or veteran homelessness across regional hubs — is the same problem at different scales. The experience also reinforced something I keep coming back to: academic rigor applied to real operational data produces work that neither side could do alone.
Acknowledgments
This research was conducted in collaboration with Lt. Jason Piotrowski and Lt. Adam Polhemus of the New Jersey State Police, Office of Drug Monitoring and Analysis. Their partnership made this analysis possible by providing access to administrative data while maintaining appropriate privacy protections.
The work was supported by the New Jersey State Policy Lab at the Edward J. Bloustein School of Planning and Public Policy, Rutgers University.
Publication
The full research summary is available on the Bloustein School website.
This project is part of Gavin Rozzi's extensive work serving the Garden State.
About the Author
