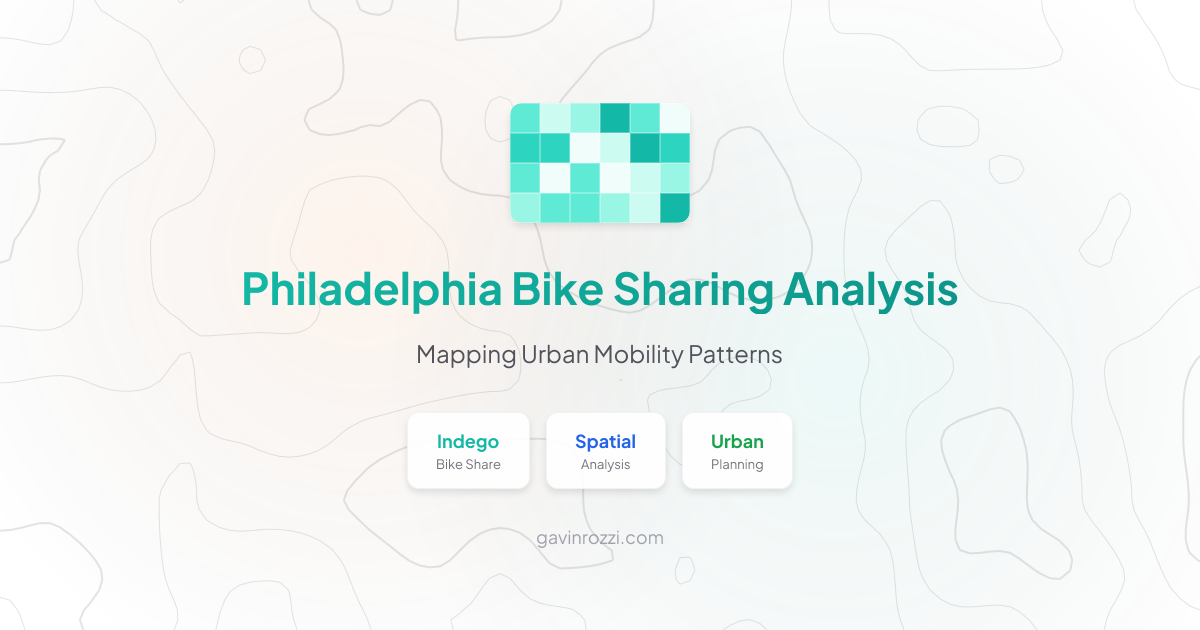
Mapping Philadelphia's Bike Sharing Data
A data visualization project using Python, GeoPandas, and matplotlib to create an animated GIF showing Indego bike sharing usage patterns across Philadelphia from 2015-2019.
Read full articleInsights on digital transformation, civic tech, and data-driven policy
A data visualization project using Python, GeoPandas, and matplotlib to create an animated GIF showing Indego bike sharing usage patterns across Philadelphia from 2015-2019.
Read full article
Interview appearance on Eyes on NJ News with host John Edmunds discussing local news and journalism in New Jersey.
Read full article
Recognized on InsiderNJ's Media 100 list for journalism and commentary on New Jersey politics and government.
Read full article
CIO Magazine featured my insights on DIY search engine optimization strategies for small business websites, including recommendations for WordPress SEO plugins and CMS alternatives.
Read full articleSubscribe to the RSS feed to get notified when new articles are published.
Subscribe via RSS