This is a 3D map of New Jersey population density at the Census-tract level, built in R using rayshader, tidycensus, and sf. It rendered at the highest geographic resolution available from the U.S. Census Bureau (the Census tract, typically 1,200 to 8,000 residents) and won first place in the 3D category at the 34th annual New Jersey Department of Environmental Protection GIS Mapmaking Contest.
Frequently asked questions
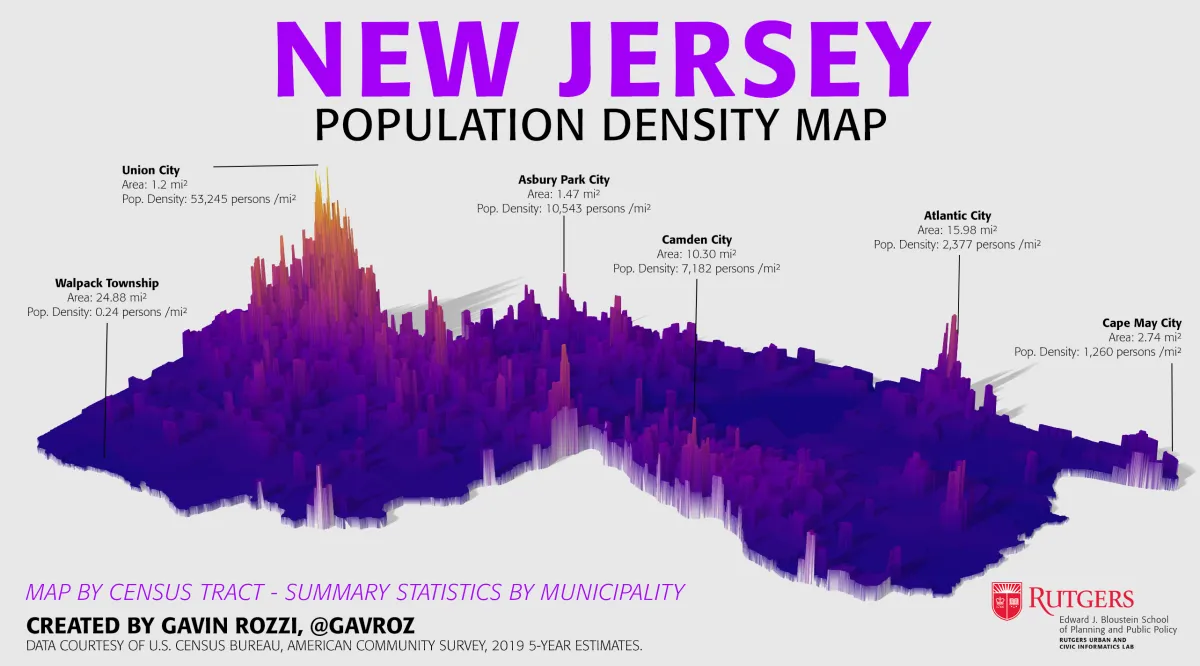
What does the New Jersey population density map show?
It shows the number of people per square mile in every Census tract in New Jersey, rendered in 3D so densely populated urban areas (Newark, Jersey City, Paterson, Elizabeth, Trenton, Camden) rise as visible ridges above suburban and rural tracts. The vertical exaggeration makes population patterns immediately legible — you can see the Northeast urban corridor, the Camden region, and the Pinelands at a glance.
How was the New Jersey population density map made?
It was built in R using rayshader for 3D rendering, tidycensus to pull American Community Survey (ACS) population estimates at the Census-tract level, and sf for spatial data manipulation. Population density was calculated as the ACS population estimate divided by the area of each tract polygon (people per square mile). A choropleth was built with ggplot2 using the viridis perceptually-uniform color scale, then converted to a 3D rendering via rayshader's plot_gg() with professional lighting settings.
Where can I download the data or source code?
The full source code, including the R script, data acquisition steps, and rendering parameters, is available on GitHub at https://github.com/RUCILab/nj-population-density-map. The underlying population data comes from the U.S. Census Bureau's American Community Survey 5-year estimates, which are publicly available via the tidycensus R package or the Census Bureau API.
Is there a 2D version of the New Jersey population density map?
Yes — the 3D rendering is built on top of a standard 2D choropleth. The choropleth code path is in the GitHub repository and can be exported by skipping the rayshader plot_gg() step. A 2D Census-tract choropleth is more practical for embedding in policy briefs and is faster to render.
What awards has the New Jersey population density map received?
It won First Place in the 3D category at the 34th annual New Jersey Department of Environmental Protection (NJDEP) GIS Mapmaking Contest in 2022, and received an Honorable Mention for Best Cartographic Design.
Can I use this map in a publication or presentation?
Yes, with attribution. The visualization is licensed for reuse in research, journalism, and educational presentations as long as it is credited to Gavin Rozzi and the source repository is linked. For commercial reuse, contact Gavin via the contact page.
Methodology
The visualization was built using the following R toolchain:
tidycensus— pulls population estimates from the U.S. Census Bureau's American Community Survey (ACS) 5-year estimates at the Census-tract level for New Jersey.sf— handles the spatial geometries (tract polygons) and computes the area of each tract for the density calculation.ggplot2+viridis— produces the 2D choropleth with a perceptually-uniform color scale.rayshader— converts the 2Dggplot2object into a 3D rendering with realistic lighting and shadow.
Core code
library(tidycensus)
library(rayshader)
library(sf)
library(dplyr)
library(ggplot2)

# Acquire population data at Census-tract level
data <- get_acs(
  variables = "B01001_001",
  geography = "tract",
  state = "NJ",
  geometry = TRUE
)

# Calculate density (people per square mile)
data <- data %>%
  mutate(pop_density = as.numeric(estimate / st_area(geometry)) * 2.59e6)

# 2D choropleth
gg <- ggplot(data) +
  geom_sf(aes(fill = pop_density), color = NA) +
  scale_fill_viridis_c(trans = "log10", option = "magma")

# 3D render
plot_gg(gg, width = 6, height = 6, scale = 250, multicore = TRUE)
Related work
- zipcodeR — R package for ZIP code-level analysis (cited in 53+ peer-reviewed publications including Nature and Cancer Discovery).
- njgeo — R package for geocoding NJ addresses against the official NJ Office of GIS API.
- NJ Opioid Spatial Analysis — H3 hexagonal spatial analysis of NJ State Police Narcan deployment data, conducted with the NJ State Policy Lab.
About the Author

About the Author