Sentiment analysis of Governor Murphy's executive orders
There has been a lot of interest in Governor Murphy’s executive orders and the various public health restrictions they’ve codified during the COVID-19 pandemic. In this post I will show how sentiment analysis can be applied to the governor’s executive orders in New Jersey to analyze the content of them.
Here is what I found:
Overall sentiment of Gov. Murphy’s 2020 Executive Orders
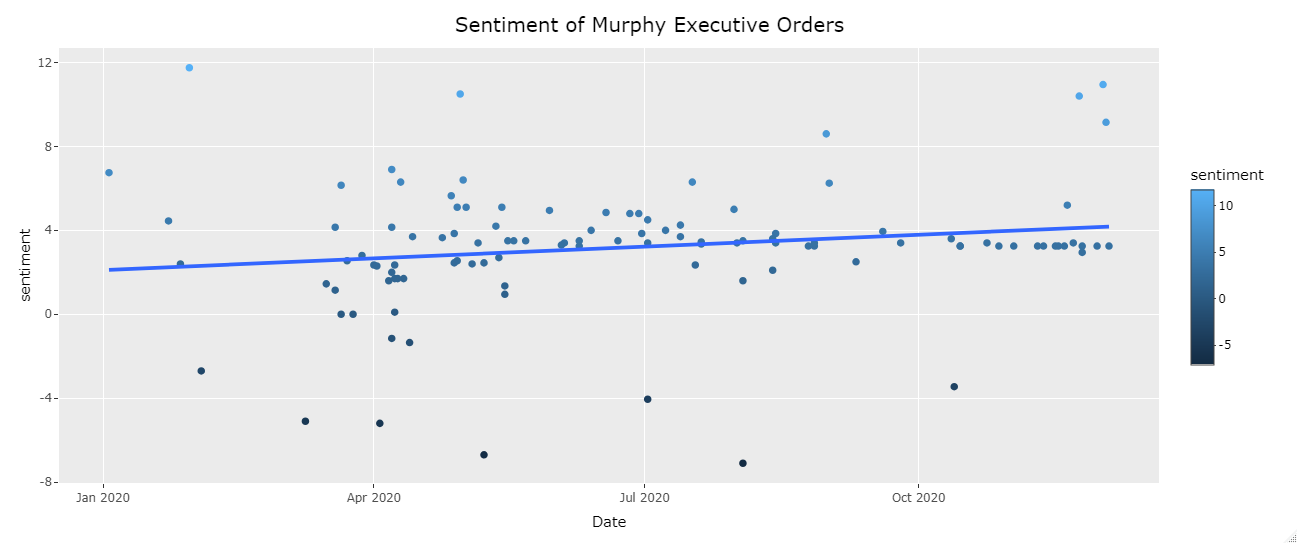
Each executive order was graphed based upon its sentiment score in the above plot.
The bottom 3 executive orders with the lowest sentiment scores in 2020 were:
- EO-174 Governor Murphy Declares State of Emergency in Response to Hurricane Isaias
- EO-139 Governor Murphy Directs U.S. and New Jersey Flags to Fly at Half-Staff in Honor of the 75th Anniversary of V-E Day
- EO-114 Governor Murphy Directs U.S. and New Jersey Flags to Fly at Half-Staff Indefinitely in Honor of Those Who Have Lost Their Lives or Have Been Affected by COVID-19
While the top 3 orders with the highest sentiment scores were:
- EO-101 Governor Murphy Directs U.S. and New Jersey Flags to Fly at Half-Staff in Honor of Former State Police Superintendent Colonel Justin J. Dintino
- EO-205 the U.S. and New Jersey flags be flown at half-staff at all state buildings and facilities on Thursday, December 3, 2020, in honor of U.S. Air Force Captain Kelliann Leli
- EO-134 Governor Murphy Directs U.S. and New Jersey Flags to Fly at Half-Staff in Honor of Former First Lady Debby Kean
Emotions in 2020 Executive Order Language
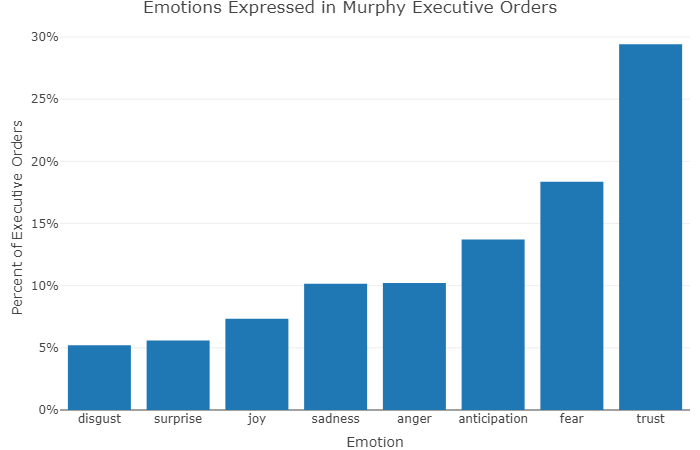
Interestingly enough, the most common emotion expressed in the governor’s executive orders was trust, followed by fear. The least two common emotions were disgust and surprise respectively. These emotions are defined by the NRC Word-Emotion Association Lexicon designed by Saif Mohamed and implemented as a function by syuzhet.
How it was done
Each time the governor signs an executive order, a PDF copy of it is posted for the public to review on the state website, typically along with a press release proclaiming its enactment.
Web scraping allows us to store a copy of each executive order for further analysis. I scraped each of the governor’s over 200 executive orders and stored them to an R dataframe, which I serve over a custom JSON REST API in order to power the new TrentonTracker website. The mechanics of the scraper and API will be covered in a future blog post.
Using the R package pdftools, I extracted the text of each executive order. Then, using the syuzhet package, I performed sentiment analysis on the text of each executive order.
The result of this code was a numerical score for each one of the governor’s executive orders. If the score was positive, then the executive order had an overall positive sentiment. But if the score was negative, then that indicated that the text of the order was not happy.
With more than 200 exective orders issued by Governor Murphy, I figured that sentiment analysis might be a good way of differentiating the various types of executive orders that the governor has issued during his tenure.
Code
library(jsonlite)
library(pdftools)
library(syuzhet)
library(tidyverse)
library(lubridate)
library(plotly)

# Obtain executive orders from TrentonTracker API endpoint
eo <- fromJSON('http://api.trentontracker.com:8000/executive-orders') %>%
  mutate(Date = as.Date(Date))

# Get the text of each executive order PDF and store it
for (i in 1:nrow(eo)) {
  eo$text[i] <- pdf_text(eo$URL[i])
}

# Calculate the sentiment of each Executive Order with syuzhet
eo$sentiment <- get_sentiment(eo$text)

# Calculate presence of emotions in Gov. Murphy's executive orders using the get_nrc_sentiments function from syuzhet
nrc <- get_nrc_sentiment(eo$text)

# Create first figure w/ 2020 EO data
fig1 <- ggplot(eo %>% filter(Date > "2019-12-31"),aes(x=Date,y=sentiment, color = sentiment)) + geom_point() +
  geom_smooth(aes(x=Date,y=sentiment),method=lm, se=FALSE)

ggplotly(fig1) %>% layout(title = 'Sentiment of Murphy Executive Orders')

# Summarize the data to create bar chart
emotions = c('disgust','surprise','joy','sadness','anger','anticipation','fear','trust')
values = as.numeric(sort(colSums(prop.table(nrc[, 1:8]))))


# Create data frame for figure 2's data
fig2data <- data.frame(emotion = emotions, value = values)

# Convert the emotions to factors so bar charts arrange properly

fig2data$emotion = factor(fig2data$emotion, levels = c("disgust","surprise","joy","sadness","anger","anticipation","fear","trust"))

fig2data = fig2data %>% arrange(desc(value))

# Figure 2, Emotions expressed in Gov. Murphy's executive orders

fig2 <- plot_ly(x = fig2data$emotion, y = fig2data$value, type = 'bar') %>%
  layout(title = 'Emotions Expressed in Murphy Executive Orders',
         xaxis = list(title = 'Emotion'), yaxis = list(title = 'Percent of Executive Orders',tickformat = "%"))
Gavin Rozzi
Pushing the boundaries of data, technology & public policy
Gavin Rozzi is a data scientist from New Jersey with expertise in leveraging public sector datasets, spatial data & mapping and emerging technologies to inform public policy development.