New Jersey Population Density Map
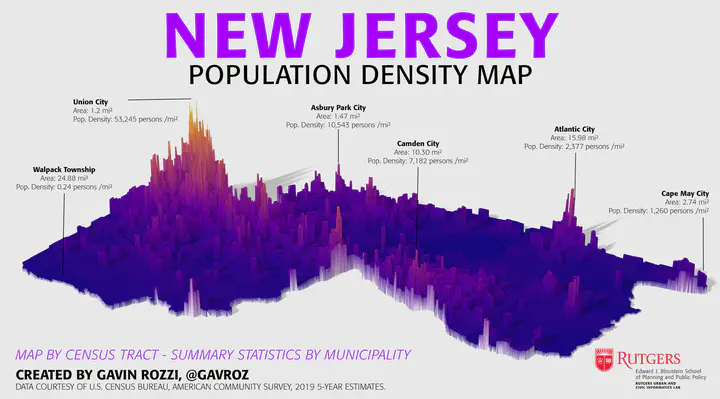
For my entry in the 34th annual New Jersey DEP GIS mapmaking contest, I created an entry that shows a population density map of New Jersey at the Census tract level. This map utilized the {rayshader} R package to create a high-quality 3D rendering and {tidycensus} for acquiring the Census data.
This map won the First Place award in the 3D category as well as an Honorable Mention for Best Cartographic Design.
The code to reproduce the map is below:
# New Jersey Population Density Map
# By Gavin Rozzi

library(tidycensus)
library(tidyverse)
library(rayshader)
library(rayrender)
library(sf)
library(viridis)
library(units)

# Acquire Data
data <- get_acs(
  variables = "B01001_001", geography = "tract", state = "FL", survey = "acs5", year = 2019,
  geometry = TRUE
) %>%
  st_transform(3424)


data <- data %>%
  mutate(
    area = set_units(st_area(data), mi^2),
    pop_density = as.numeric(estimate / area)
  )


# Build Plot
plot <- data %>%
  ggplot(aes(fill = pop_density)) +
  geom_sf(color = NA) +
  scale_fill_viridis_c(option = "plasma", trans = "sqrt") +
  theme(
    axis.line = element_line(colour = "transparent"),
    panel.grid.minor = element_blank(),
    panel.grid.major = element_blank(),
    panel.border = element_blank(),
    axis.title.x = element_blank(),
    axis.title.y = element_blank(),
    axis.ticks = element_blank(),
    axis.text = element_blank(),
    panel.background = element_rect(fill = "transparent", color = NA),
    plot.background = element_rect(fill = "transparent", colour = NA),
    legend.text = element_text(color = "transparent"),
    legend.title = element_text(color = "transparent"),
    legend.position = "blank"
  )

plot

# Render to 3D
plot_gg(plot,
  width = 6, height = 6,
  scale = 300,
  multicore = TRUE,
  fov = 60, theta = 270, phi = 25,
  zoom = 0.20,
  offset_edges = FALSE,
  windowsize = c(4000, 4000)
)

render_snapshot("nj.png")
render_highquality("njdensity_4k.png", lightdirection = c(270))
render_movie("movie.mp4", title_text = "Population Density of New Jersey")
Gavin Rozzi
Pushing the boundaries of data, technology & public policy
Gavin Rozzi is a data scientist from New Jersey with expertise in leveraging public sector datasets, spatial data & mapping and emerging technologies to inform public policy development.